
For decades, sports and community programs were seen as just expenses. They were viewed as something to manage, not to grow. This way of thinking is now outdated.
Recent studies have shown a groundbreaking truth. Physical activity is not just a cost. It’s a smart investment in our social and economic well-being.
Today, leaders want to see results. This need has led to two key tools: traditional ROI and Social Return on Investment (SROI). These are vital for CFOs, funders, and those shaping communities.
A global review of data has shown the value of these benefits. A study in the UK found a clear return of £4.38 for every pound invested.
This isn’t just about numbers. It’s about unlocking new funding opportunities. By measuring both financial and social gains, we can change how we value sports and programs. It’s about making the unseen, seen.
Introduction: Speaking the language of CFOs and funders
In today’s world, getting a Chief Financial Officer’s attention is not just about stories. You need to speak their financial language. This means turning the power of sports into numbers that investment committees and budget sheets understand. It’s not just helpful; it’s essential for getting and keeping funding.
How sponsors and funders make decisions is changing. They’re moving from “love of the sport” to focusing on real KPIs and value. The corporate world has always valued this approach. Now, the public and social sectors want the same level of accountability.
Heartfelt stories alone can’t get you the funding you need anymore. Today, boardrooms and council chambers want proof. They ask: what’s the measurable return on our investment? To answer, sports groups must learn to speak in terms of metrics, ratios, and financial impact.
The table below shows the big change in how to talk to today’s financial stakeholders:
| Old Paradigm: Emotional Appeal | New Mandate: Financial & Social Accountability |
|---|---|
| “We change lives through sport.” | “We deliver a 3:1 Social Return on Investment (SROI) by reducing future healthcare costs.” |
| “Our program builds character.” | “Our intervention correlates with a 15% increase in school attendance, which boosts future earnings.” |
| “We need support to keep our doors open.” | “Every public dollar invested brings in $2.50 in volunteer time and private sponsorship.” |
| “Trust us, it makes a difference.” | “Here is our dashboard showing participation, outcomes, and cost per youth.” |
The Social Return on Investment (SROI) framework is key. It helps turn social benefits like better health and education into dollar values. This way, you can show funders a clear, data-backed return that speaks to their financial interests.
For example, SROI often shows a 3:1 or even a 4.38:1 return. This means for every dollar invested, you get three to four dollars in social and economic value. Showing this kind of cost–benefit analysis makes your proposal sound like a smart investment.
Learning to talk about your impact in numbers is essential for getting funding. It shows you understand the financial world and can turn social good into a responsible investment. This approach gets you noticed and opens doors.
Define ROI vs SROI: monetizing outcomes responsibly
Traditional ROI looks at direct money gains. Social Return on Investment (SROI) changes this by valuing social, environmental, and economic gains. This shift is key to measuring impact today.
ROI is a known financial metric. It shows the money made from an investment. You just divide the financial gains by the investment cost. It’s all about profit and loss.
Social Return on Investment (SROI) goes beyond the financial. It started to measure social impact. It looks at people, planet, and profit together.
SROI turns social and environmental gains into money. So, better health, more education, and safer places get a financial value. This makes a strong ratio, like ROI, but for total value.
This new way is based on eight key principles. These ensure the analysis is solid, trustworthy, and fair.
The principles are: involve stakeholders, understand what changes, value the things that matter, only include what is material, do not overclaim, be transparent, verify the result, and be responsive. They are the foundation for fair valuation.
How does SROI differ from cost-benefit analysis (CBA)? CBA looks at direct costs and benefits for one entity. SROI looks at impacts on all stakeholders.
For example, a youth sports program benefits participants, their families, healthcare, and employers. SROI captures these wide-ranging effects.
The following table shows a side-by-side comparison of these three models:
| Framework | Primary Focus | Scope of Value | Core Metric | Guiding Philosophy |
|---|---|---|---|---|
| Traditional ROI | Financial profitability | Direct financial inflows/outflows | Monetary ratio (e.g., $3:$1) | Maximize financial return on capital |
| Cost-Benefit Analysis (CBA) | Economic efficiency of a project or policy | Tangible costs & benefits, often to a single entity | Net Present Value (NPV) | Determine if benefits outweigh costs |
| Social Return on Investment (SROI) | Holistic social, environmental, & economic impact | Monetized value for all stakeholders | Social value ratio (e.g., $4.50:$1) | Understand, manage, and maximize total value creation |
Choosing SROI means valuing outcomes responsibly. It avoids exaggerating results. It involves stakeholders and is transparent, making the analysis real.
For leaders, SROI is a game-changer. It uses financial terms to talk about community investments. It tells the full story of change.
Outcome Domains: Health, Education, Safety, and Workforce
Global research shows how sports investments impact community well-being. A key study found that sports programs affect different areas of life. This helps measure a program’s social value.
The evidence points to four main areas of influence:
- Health: Reducing BMI and preventing chronic disease.
- Education: Boosting school attendance and academic achievement.
- Safety: Lowering juvenile incidents and fostering prosocial behavior.
- Workforce: Building readiness through developed soft skills and discipline.
These areas are at the heart of a strategy to improve communities through sports.
Transforming Community Health Landscapes
The biggest impact is on health outcomes. A huge 94.5% of studies showed positive effects. Sports programs help fight rising youth BMI and prevent diseases like diabetes and heart conditions.
This isn’t just about staying fit. It’s about avoiding future health costs and promoting lifelong wellness. Regular exercise builds habits that prevent medical issues later on.
Elevating Academic Performance and Engagement
Investments in athletics lead to strong academic outcomes, with 83.6% of studies confirming this. The link is clear: sports improve school attendance and GPA.
Athletes develop skills like focus, time management, and goal-setting. These skills help them succeed in school. Success in sports boosts confidence in other areas of life.
Driving Community Safety Through Crime Reduction
Sports funding is key for crime reduction. Research shows 50.9% of studies found sports participation lowers juvenile incidents and delinquent behavior.
Programs offer structure, positive mentorship, and a healthy outlet for energy. They promote positive behavior and reduce negative actions. This makes neighborhoods safer and reduces the need for juvenile justice.
Building the Workforce and Foundational Well-being
Sports also boost future economic vitality. They develop teamwork, leadership, and resilience. These skills are vital for workforce readiness. The review also highlights the impact on subjective well-being (89.1%) and social capital (60%).
As one program director said, “We’re not just creating athletes; we’re nurturing confident, connected, and capable future workers.” These outcomes are essential for a thriving society.
This detailed mapping shows that sports initiatives can greatly impact community health, safety, education, and economic growth.
Methods: comparison groups, pre/post, proxy values; caution on attribution
At the heart of any credible Social Return on Investment calculation sits a triad of methodological pillars: comparison groups, pre/post analysis, and proxy valuation. This framework transforms abstract social good into concrete financial terms. It provides the rigorous evidence that funders and policymakers demand.
The journey begins with mapping the theory of change. This involves tracing the logical pathway from inputs (resources invested) through outputs (activities delivered) to outcomes (changes experienced) and ultimately impact (the portion of change attributable to your program). This visual map is the essential blueprint, ensuring every subsequent calculation connects directly to your intervention’s intended effects.
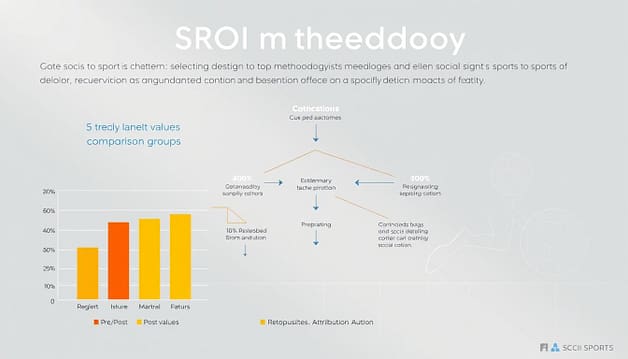
Establishing what would have happened without your program is the critical first analytical step. This is achieved through comparison groups—selecting a demographically similar cohort not receiving the intervention—or through pre/post analysis measuring participants against their own baselines. Both methods create the counterfactual, the essential benchmark against which real change is measured. Without this baseline, attribution becomes guesswork.
The revolutionary leap in SROI methodology is the application of financial proxies. These are carefully researched values assigned to non-market outcomes, effectively monetizing social change. For instance, the cost of an emergency room visit avoided becomes the proxy value for improved health outcomes. The market rate for tutoring services proxies academic improvement. This innovative approach bridges the worlds of social service and financial analysis.
Several authoritative valuation methods inform these proxies. Well-being valuation uses large-scale population surveys to determine how much income individuals would trade for improvements in health, safety, or life satisfaction. Cost databases from government agencies and research institutions provide standardized figures for everything from juvenile detention to chronic disease management. These resources lend external credibility and consistency to your calculations.
But the true mark of rigorous SROI practice lies in what you subtract, not just what you claim. Responsible analysis applies four key adjustments to avoid overstatement:
- Deadweight: The portion of change that would have occurred without any intervention. This adjustment acknowledges natural maturation, broader societal trends, or other existing services.
- Attribution: The percentage of change actually caused by your specific program, acknowledging that other organizations, family support, or individual effort also contributed.
- Displacement: Whether the positive impact in one area simply shifted a problem elsewhere, creating net community benefit.
- Drop-off: Accounting for how long outcomes last—some effects diminish over time and must be discounted.
These adjustments are not mere technicalities; they represent the ethical backbone of SROI. Principle 5 of the international SROI framework explicitly mandates: “Do not overclaim.” This conservative, transparent approach builds trust with sophisticated audiences who are wary of inflated impact claims. As one foundation director notes, “The programs that openly discuss their attribution rates are the ones we trust with larger investments.”
The methodology’s power lies in its balanced approach to the cost-benefit equation. By systematically valuing outcomes and honestly adjusting for external factors, organizations can demonstrate not just that they do good, but that they create value efficiently. This transforms the conversation from charitable appeal to strategic investment discussion.
Ultimately, rigorous methodology protects both the organization and the community it serves. It prevents mission drift by focusing resources on what truly creates change. It builds a culture of data-driven decision making. And it provides a defensible, credible story of impact that withstands scrutiny from even the most skeptical financial officer. The numbers tell a story, but only if they’re built on a foundation of methodological integrity.
Data you can collect locally: participation, hours of play, scholarships, volunteer time, facility utilization
Collecting data locally is more than just paperwork. It’s the key to showing how your work makes a big difference. By focusing on key metrics, you can turn your efforts into clear results.
Think of these metrics as the basic ingredients. Mix them with research to show the real value of your work. This way, you can prove how your efforts lead to better health outcomes and academic outcomes.
Every community sports group should track these five important metrics:
Participation Rates: Count how many people you serve. Break it down by age, gender, and area. This shows who you’re helping and where you can do more.
Hours of Physical Activity Delivered: Log all the time spent on sports. This helps show how you’re reducing health risks. It’s a key way to improve health outcomes.
Scholarships Awarded: Track how many kids get help paying to play. This shows your commitment to fairness. It also helps attract more funding.
Volunteer Hours Contributed: Record the time given by coaches and parents. This shows the value of community support. It’s a big part of your social impact.
Facility Utilization Rate: See how well you use your space. High use means you’re making the most of public investment.
When you connect these metrics, you unlock your true value. The table below shows how to get started.
| Key Output Metric | How to Measure It | Primary Outcome Domain Connection |
|---|---|---|
| Participation Rates | Unique registrants per program cycle; demographic tracking. | Community Engagement, Social Inclusion |
| Hours of Physical Activity | Sum of coached minutes across all sessions. | Health Outcomes (BMI, chronic disease risk) |
| Scholarships Awarded | Count of fee waivers; total monetary value of aid. | Economic Accessibility, Equity |
| Volunteer Hours | Timesheets or sign-in logs for all non-staff labor. | Social Capital, Community Value |
| Facility Utilization | Scheduled hours / Total available hours x 100. | Asset Efficiency, Public ROI |
This method turns simple tracking into valuable insights. Each piece of data helps build a strong case. You can show how sports improve school performance and health.
Begin now. Train your team to collect these metrics regularly. You’re not just running programs; you’re creating proof of your impact.
Example calculations: avoided healthcare costs; cost per youth served; $ leveraged per $ public spend
Showing value means moving from just counting what you do to showing what you achieve. This is done through three key metrics: avoided healthcare costs, cost per youth served, and dollars returned per public dollar spent. Learning these calculations turns your program’s story into a strong message of financial wisdom.
The first metric focuses on health benefits. Sports programs help people avoid future health problems like obesity and diabetes. By using proxy values, like the cost of treating diabetes, we can put a dollar amount on each case prevented. This shows how saving on health costs is a key part of cost–benefit analysis.
The second metric, cost per youth served, shows how well your program runs. It’s found by dividing total costs by the number of participants. A lower number means your program is efficient and can grow. This figure helps compare your program to others, showing its value in a cost-effective way.
The top of any social return on investment analysis is the big return ratio. Take the UK’s example. They spent £36.2 billion on sports and got £165.4 billion in value back. The math is clear: £165.4bn ÷ £36.2bn = £4.38. For every pound spent, society got almost four and a half pounds in return.
| Calculation Type | Formula & Example | Strategic Implication |
|---|---|---|
| Avoided Healthcare Cost | (# of Cases Prevented) x (Avg. Treatment Cost). e.g., 50 cases of asthma avoided x $5,000/case = $250,000 saved. |
Demonstrates direct public sector savings and justifies preventive spending. |
| Cost Per Youth Served | Total Program Cost ÷ # of Unique Participants. e.g., $100,000 budget ÷ 500 youth = $200 per youth. |
Measures program efficiency and scalability for funder comparisons. |
| Leverage Ratio | Total Social Value Created ÷ Total Public Investment. e.g., £165.4bn ÷ £36.2bn = £4.38 return per £1. |
Provides the ultimate social return on investment headline to attract capital. |
These models are not mysterious. They are based on clear methods that anyone can use. For a deeper look, check out cost-benefit frameworks to learn more. The aim is to go from claiming impact to proving it with numbers that grab attention and open up resources.
The £4.38 return is more than a number—it’s a blueprint to follow. It shows how investing in community sports can have a big impact. By using these examples, your organization can show its own big social return on investment possibilities.
Story + stats: combining maker/athlete stories with dashboards
Today, advocacy needs two paths: one for numbers and another for feelings. The best case for support comes from where data and stories meet.
This new way—the “dashboard and documentary” method—weaves a compelling story. It mixes the facts funders want with the passion that moves people.
The dashboard shows the numbers. It tracks how many people are involved and the results. It’s key for leaders who focus on SROI, showing how programs improve health outcomes and education.
The data proves the investment is worth it. It answers the “what” and “how much” clearly. At the same time, the documentary shares real stories. It’s about the “makers”: the coach, the parent, and the athlete who benefited.
This mix of data and stories creates a strong bond. Numbers show the scale, but stories reveal the heart. Together, they prove the program’s success and its importance.
| Component | The Dashboard | The Documentary |
|---|---|---|
| Primary Purpose | To quantify impact and validate financial or strategic investment. | To humanize impact and validate the core mission and values. |
| Core Content | Live metrics, participation data, SROI calculations, health outcomes trends. | Authentic quotes, video testimonials, photo essays, and personal journey narratives. |
| Audience Appeal | Appeals directly to the analytical, data-driven mindset of CFOs, grant officers, and board members. | Resonates with the empathetic, values-driven heart of community leaders, donors, and the public. |
| What It Validates | Validates the efficiency, scalability, and return on investment of the program model. | Validates the transformational, life-changing purpose and community need for the program. |
Showing both sides changes the conversation. It shifts from talking about costs to showing the value. This is the best way to support work that changes lives. It gives the numbers for funding and the stories that inspire a lasting impact.
Presenting ROI: one-pager, board deck, talking points for council meetings
Your social return on investment analysis is powerful. It’s not just about the numbers. It’s about how you share them. This stage turns complex data into a tool for change.
Every group needs a different approach. The boardroom wants clear data and plans. The public wants stories and benefits. This section gives you tools for each situation, helping make decisions with confidence.
The Compelling One-Pager: Your Impact at a Glance
This single sheet is your key advocacy tool. It should grab attention quickly and be easy to scan. Make it impactful.
- The Headline Ratio: Start with a strong figure. “For every $1 invested, our program returns $4.20 in social value.” This sets the value conversation.
- Top Outcome Highlights: Show two to three key results. Include academic outcomes and health metrics. Use icons and bold numbers.
- A Human Voice: Add a powerful quote from someone involved. This makes the data real and touching.
- Clear Call to Action: Say exactly what you need—funding, a partnership, or policy support.

When talking to directors or funders, tell a story. Start with the big problem and then show your solution.
- The Opening Frame: Begin with a local statistic that shows the problem. Connect it to community needs.
- Methodology in a Minute: Quickly explain how you evaluated your program. This builds trust without getting too technical.
- The Results Dashboard: Show your findings with clear charts. Focus on financial benefits and strong data areas.
- The Strategic Ask: End with a clear proposal. Link your social return on investment to the organization’s goals.
Council Meeting Talking Points: Translating Data for the Public
Public officials care about community benefits. Your talking points should make complex data easy to understand and persuasive.
Start by thanking the council. Then, link your work to a city plan or goal. Say, “Our program supports the city’s goal to improve youth safety and health.”
Share a key data point: “Last year, 85% of our participants improved their school attendance.” Then, tell a story about one person who changed. End with an opportunity: “With a small investment, we can help more neighborhoods.”
This approach combines a strong funding story with a personal touch. It’s very effective.
This toolkit does more than share data. It turns evidence into a strong case for investment and growth.
Risks & ethics: overclaiming, privacy, inclusion metrics
Measuring impact in dollars is important, but the real power of Social Return on Investment (SROI) lies in its ethics. A good strategy turns risks into trust with funders and communities.
One major risk is overclaiming. Principle 5: Do Not Overclaim is key. It means giving credit where it’s due, not taking too much. For example, saying a program cut crime by itself is not accurate. It’s about the part it played, not the whole.
Handling data ethically is also vital. When tracking impact, you must protect people’s privacy. This means clear policies, consent, and keeping data safe. It’s about serving the community, not just using it for numbers.
Lastly, a good SROI looks at who benefits. It’s not just about numbers. It’s about fairness across all groups. This goes beyond just counting who’s there. It’s about real change, like in sports programs.
Talking about these risks shows strength, not weakness. It means you’re transparent and credible. By focusing on ethics, you build a strong base for lasting change and partnerships.
Downloadables: SROI calculator sheet, board slide template
Now, measuring social return on investment is easier than ever. Get ready to turn insights into action with top-notch tools at your fingertips.
Our SROI calculator spreadsheet is a game-changer. It simplifies complex data into easy-to-understand values. It uses formulas to show the financial benefits of better health, less crime, and improved education. This makes understanding cost–benefit analysis a breeze.
Present your findings with confidence using our professionally designed board slide template. It turns your SROI data into a compelling story for stakeholders. The template helps you organize your evidence to make a strong case in funding discussions.
These downloadables make the article’s advice easy to use. They help any organization show its impact and create winning proposals. Start showing your social return on investment with precision and clarity today.