
For decades, youth sports schedules followed a familiar formula: practices after school, games on weekends, and tournaments packed into long summer days. Weather was considered, but rarely studied. If temperatures climbed too high, coaches improvised with water breaks and shade.
That model is rapidly becoming outdated.
Across the United States and around the world, climate volatility is forcing youth sports organizations to rethink how and when games are played. Extreme heat events are becoming more frequent, humidity levels are rising, and wildfire smoke now disrupts seasons in regions that previously faced few environmental interruptions.
In response, leagues, school districts, and municipal sports programs are increasingly turning to climate data and heat mapping tools to guide scheduling decisions. The goal is simple but critical: ensure safe play without sacrificing participation.
Why Traditional Scheduling Models Are Breaking Down
Most youth sports leagues historically relied on fixed seasonal schedules. Spring sports began in March, summer tournaments ran through July, and practices typically started in the late afternoon.
However, climate conditions no longer follow predictable patterns.
Heat waves now appear earlier in the year and last longer than historical averages. Urban areas experience additional warming from heat island effects, where asphalt parking lots, artificial turf fields, and surrounding infrastructure trap heat.
For young athletes, these conditions increase the risk of dehydration, heat exhaustion, and more serious heat-related illnesses.
The challenge is not simply temperature—it is the combination of heat, humidity, sun exposure, and recovery time between activities. This is why many sports organizations are shifting toward data-driven safety thresholds rather than relying on general weather forecasts.
Climate-informed scheduling allows administrators to evaluate when fields are safest for activity and when games should be delayed, shortened, or moved indoors.
Understanding Heat Index And Wet Bulb Temperature
Two key measurements are shaping the future of youth sports scheduling: heat index and Wet Bulb Globe Temperature (WBGT).

The heat index estimates how hot conditions feel to the human body by combining air temperature and humidity. WBGT goes further by incorporating solar radiation and wind speed, making it one of the most accurate indicators of environmental heat stress.
Many athletic associations now use WBGT thresholds to determine safe activity levels.
| Environmental Metric | What It Measures | Why It Matters |
|---|---|---|
| Air Temperature | Ambient temperature in the shade | Basic heat conditions |
| Heat Index | Temperature + humidity | Indicates perceived heat stress |
| WBGT | Temperature, humidity, solar radiation, wind | Most accurate measure of athletic heat risk |
| Surface Temperature | Heat retained by turf or pavement | Determines field-level heat exposure |
Organizations such as the American College of Sports Medicine recommend WBGT monitoring during high-heat conditions to guide activity modifications.
When WBGT thresholds exceed safe levels, leagues may shorten practices, increase rest intervals, or suspend play entirely.
Heat Mapping Sports Facilities
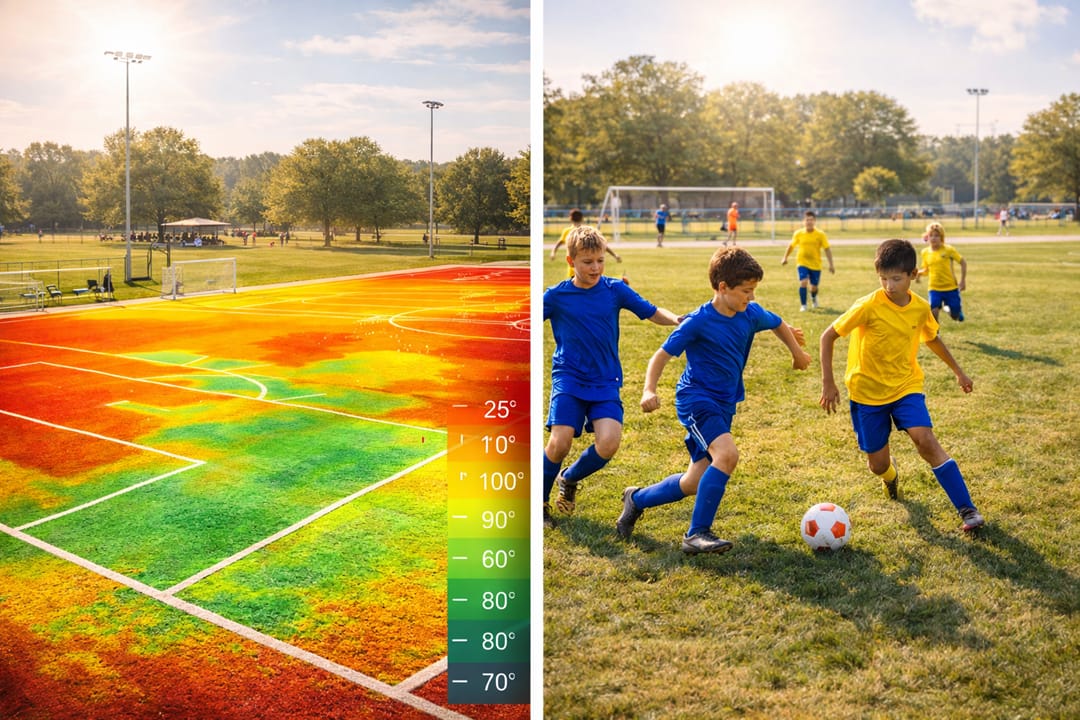
Beyond weather data, facility managers are increasingly using heat mapping technology to understand how heat behaves across sports complexes.
Heat maps measure surface temperatures in different parts of a facility, revealing areas where heat accumulates most intensely. Artificial turf fields, parking areas, and concrete seating sections often record temperatures significantly higher than surrounding grass or shaded areas.
These findings have important scheduling implications.
A field that appears safe based on regional weather data may still expose athletes to dangerous conditions if surface temperatures are significantly elevated.
Heat mapping allows administrators to identify:
- Fields with the highest heat retention
- Time-of-day temperature spikes
- Locations where shade or cooling infrastructure is needed
By integrating these insights into scheduling decisions, leagues can distribute games more safely across available fields.
Climate Data And Smarter Game Scheduling
Climate-informed scheduling is not just about avoiding the hottest hours of the day. It requires a broader understanding of how weather patterns evolve across a season.
Many programs now use historical climate data to redesign competition windows.
For example:
- Practices may shift to early morning sessions during peak summer months.
- Weekend tournaments may begin earlier to avoid late-afternoon heat spikes.
- Seasonal schedules may move forward or backward by several weeks.
These changes can significantly reduce heat exposure without reducing participation.
Some leagues also integrate environmental monitoring systems directly into facility operations. Digital dashboards track weather conditions, humidity levels, and air quality in real time, allowing administrators to adjust schedules quickly when conditions change.
These data-driven approaches complement broader environmental strategies discussed in the analysis of air quality safety , where climate monitoring has become a central part of player safety.
Building Climate-Resilient Sports Programs
Adapting youth sports schedules to climate data is part of a larger shift toward climate-resilient sports infrastructure.

Facility designers and administrators increasingly recognize that safety cannot depend solely on reactive decisions made during extreme weather events. Instead, programs must plan for environmental volatility as a normal part of operations.
Strategies often include:
- Expanded shaded seating areas
- Hydration stations and cooling zones
- Turf alternatives that reduce heat absorption
- Flexible scheduling policies for leagues and tournaments
Communities that adopt these practices are better positioned to maintain consistent programming even as climate patterns become less predictable.
The Future Of Safe Play
Climate data is transforming how youth sports programs operate. What once depended on intuition and experience now relies on real-time environmental monitoring and predictive analysis.
This shift represents more than a technical upgrade—it reflects a broader understanding that youth sports must adapt to changing environmental realities.
When leagues use climate data to guide scheduling, they protect athletes while preserving the core benefits of youth sports: competition, community, and physical activity.
Safe play in the coming decades will not simply depend on better coaching or improved facilities. It will depend on how intelligently communities interpret the climate information available to them.
By integrating heat mapping, environmental monitoring, and flexible scheduling policies, youth sports programs can ensure that the games continue—safely—even as the climate changes.