
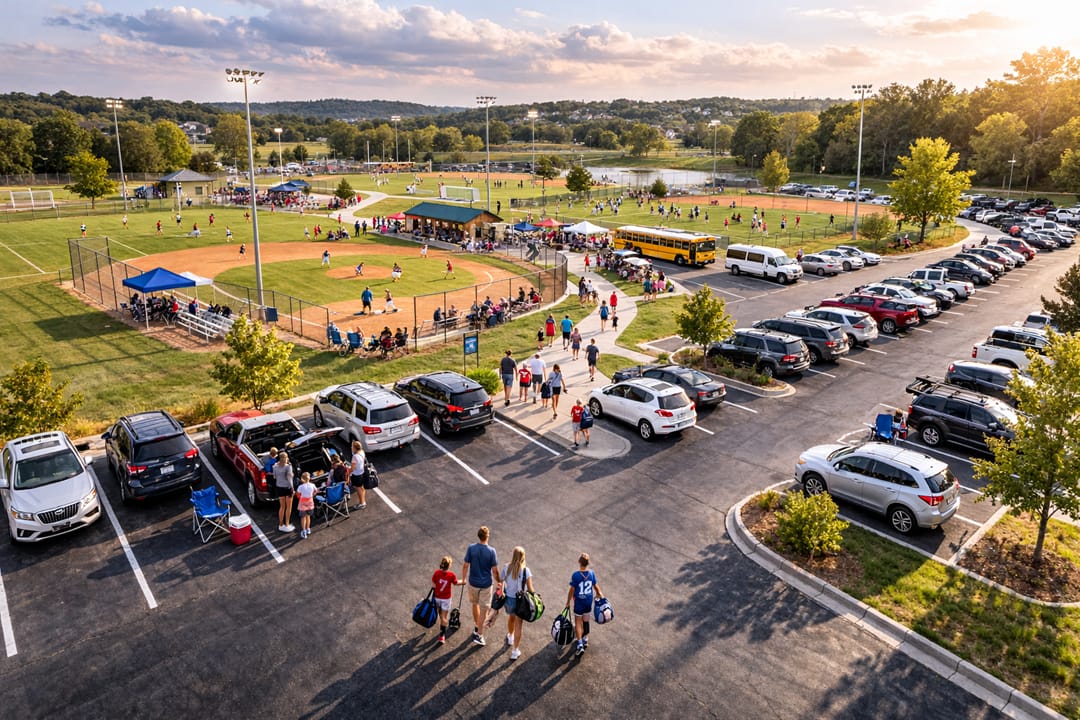
The scoreboard tells one story. The parking lot tells another.
On any given tournament weekend, hundreds of cars idle outside community sports complexes. Charter buses line the curb. Flights carry elite travel teams across state lines. Parents caravan from hotel to field and back again. The competition lasts 90 minutes. The carbon footprint lingers far longer.
Youth sports are framed as healthy, character-building, and community-centered. All true. But there’s a hidden cost that rarely appears in program brochures: transportation emissions. If we’re serious about sustainability in community sports, we can’t stop at facility upgrades. We have to look beyond the field.
The Real Footprint of a Weekend Tournament
For many programs, the largest environmental impact does not come from lighting or irrigation. It comes from travel.
A local recreation league may keep games within a 10-mile radius. A regional travel team may log 150 miles in a single weekend. National showcase events introduce flights, rental cars, and multi-night hotel stays. Multiply that by dozens of families, and transportation quickly becomes the dominant emissions source.
Here’s a simple comparison of competition models:
| Program | Average Travel Distance | Transportation Mode | Emissions Impact |
|---|---|---|---|
| Local Recreation League | 5–15 miles | Personal vehicles, occasional carpool | Low to Moderate |
| Regional Travel League | 50–150 miles | Personal vehicles, charter buses | High |
| National Tournament Circuit | 300+ miles | Flights, hotels, rental cars | Very High |
| School-Based Athletics | 10–40 miles | Full school buses | Moderate (lower per athlete when buses are full) |
When families drive separately, emissions multiply. When tournaments are centralized in distant complexes, impact grows again. League structure quietly determines environmental impact.
Scheduling as a Sustainability Strategy
League administrators rarely think of themselves as climate decision-makers. But scheduling is governance. And governance shapes transportation patterns.

Smart scheduling can reduce emissions without reducing opportunity.
| Strategy | How It Reduces Emissions | Key Consideration |
|---|---|---|
| Regional Pod Scheduling | Groups nearby teams together | Requires competitive balance |
| Back-To-Back Game Blocks | Reduces repeated multi-day trips | Athlete recovery planning |
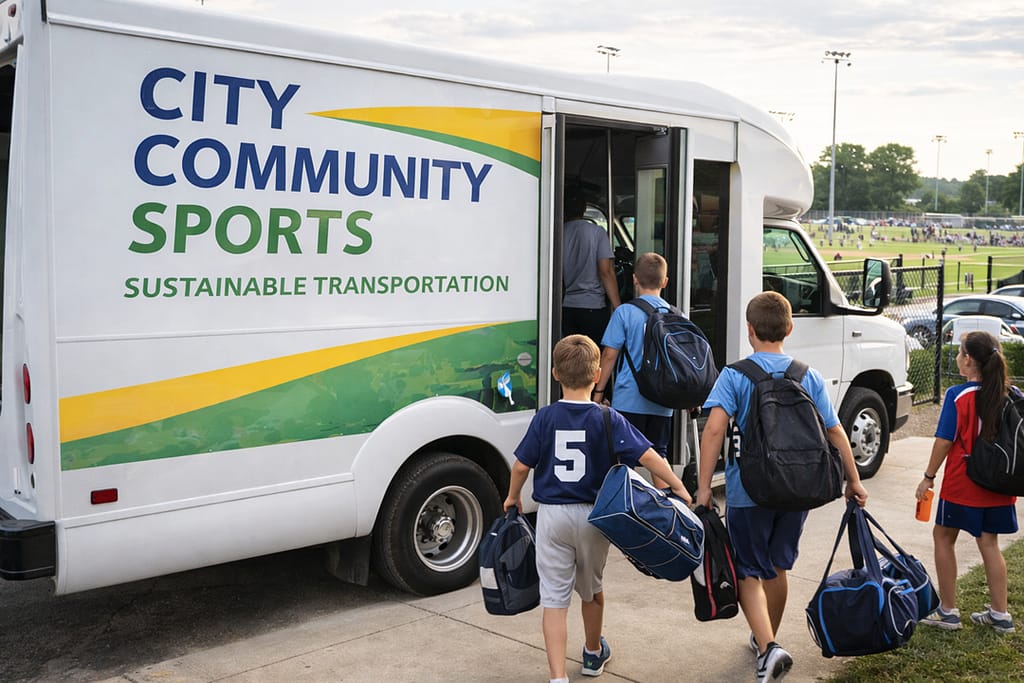
| Centralized Bus Transportation | Replaces multiple family vehicles | Coordination and cost sharing |
| Tournament Clustering | Consolidates travel into fewer trips | Field capacity and logistics |
None of these strategies eliminate competition. They improve structure. Distance should be treated as a managed resource, not a default expectation.
The Cultural Weight of Travel Teams
There’s also a cultural layer to this issue.
Travel teams promise exposure, scholarships, and elite competition. Over time, long-distance play becomes normalized as the standard pathway to advancement. For some families, that’s manageable. For others, it creates layered burdens: financial strain, missed school time, and increased environmental cost.
Long-distance competition often increases registration fees, hotel and meal expenses, lost instructional time, and per-athlete emissions.
If your mission includes equitable access to participation, travel models matter. A system that requires constant long-distance movement can unintentionally exclude families who cannot absorb those costs.
Sustainability and equity intersect here. Smarter regional design can reduce emissions while widening access.
Transportation Partnerships and Shared Solutions
Community programs do not have to solve transportation impact alone. Partnerships can shift the model from fragmented travel to coordinated movement.
| Partner Type | Potential Contribution | Shared Benefit |
|---|---|---|
| School District Transportation | Weekend bus fleet access | Improved efficiency and safety alignment |
| Local Transit Authority | Event-day shuttle routes | Increased ridership and community visibility |
| Municipal Sustainability Office | Emissions tracking support | Progress toward city climate targets |
| Corporate Sponsors | Green transportation mini-grants | Brand alignment with community responsibility |
Transportation should be reframed not as a convenience issue, but as infrastructure. When youth sports position themselves as partners in broader community sustainability efforts, funding opportunities expand.
Measuring What Matters
Reform begins with visibility.
You don’t need advanced software to begin tracking travel impact. A simple, consistent log can reveal patterns that anecdotes miss.
| Data Point to Track | Collection Method | Frequency | Actionable Insight |
|---|---|---|---|
| Average Team Travel Distance | Coach post-event log | Each event | Identifies high-impact divisions |
| Vehicle Count Per Event | Parking lot headcount | Select weekends | Measures carpool participation |
| Bus Utilization Rate | Roster vs. capacity comparison | Game day | Improves fleet efficiency |
| Flight-Based Travel Incidents | End-of-season reporting | Annual | Signals opportunities to regionalize competition |
Once you have baseline data, set internal targets. Reduce average travel miles. Increase shared transportation use. Track improvement season over season.
From Convenience to Responsibility
Transportation reform in youth sports is not about restriction. It’s about alignment.
If programs teach responsibility, teamwork, and long-term thinking, operations should reflect those values. Reducing unnecessary travel can lower long-term program costs, protect athlete time and recovery, expand participation access, and reduce environmental impact.
Climate resilience does not end at the sideline. It includes how we move people to the sideline in the first place.
The field is only part of the system.
The road there matters too.