
Ever wonder why Major League Baseball teams get $2 billion for stadiums? Yet, your local little league’s bleachers look like Mad Max props? It’s not just bad luck. It’s about financial curveballs that most rec leagues don’t see coming.
The Aspen Institute’s School Sports Equity Toolkit shows a harsh truth. Resource allocation in sports mirrors America’s inequality. Cities give tax breaks to pro teams fast, but community programs struggle for basic equipment grants.
MLB stadiums make $5-10 million a year for cities. But your neighborhood soccer league builds social capital that can’t be measured by spreadsheets.
We’re looking at why “equity” in sports feels like a seventh-inning stretch for politicians. From Little League diamonds to NBA arenas, the game is rigged. But there’s a steal sign they don’t want you to see. Ready to turn your sandlot squad into a fiscal MVP? Let’s play ball.
Common Funding Barriers
Applying for community sports grants is like an Olympic event. The paperwork is so thick, it would disqualify 90% of small organizations before they even start. Let’s look at the three strikes that keep local leagues from getting funding:
- Grant applications thicker than a Michael Lewis novel: Why do small teams need to fill out so much paperwork?
- The “cool kids” funding bias: Travel teams get all the funding, while rec leagues struggle to get by.
- Impact metrics designed by spreadsheet warlocks: Measuring “social ROI” shouldn’t be this complicated.
Chicago Public Schools’ Moving Forward Together equity index shows a way to overcome these challenges. Their funding approach focuses on:
| Traditional Criteria | CPS Equity Index | Why It Matters |
|---|---|---|
| Historical performance data | Community need indicators | Levels the playing field |
| Complex budget projections | Participation accessibility | Rewards inclusion |
| Donor popularity contests | Geographic disparity scores | Targets real gaps |
Here’s the kicker: Programs in high-need neighborhoods saw 37% faster funding approvals last year. They focused on real community impact, not just impressing MBA committees.
Next time a foundation asks for your 10-year forecasts, ask two questions. “How many kids will get cleats this season?” and “When’s the last time you watched a 7-year-old discover they’re good at something?” Sometimes, the best metrics are the ones that show real, on-the-ground results.
Grant Opportunities and How to Apply

Grant applications can be as thrilling as a March Madness buzzer-beater. The real magic is in treating funding searches like scouting talent. Chicago Public Schools, for example, turned social-emotional learning into a $16M win by framing after-school boxing as “anti-racism infrastructure.” That’s cultural competence with a punch.
At last year’s Project Play Summit, student advocates revealed three key strategies:
- Treating grant deadlines like playoff brackets – prioritize or perish
- Weaving school community partnerships into narratives tighter than a new baseball glove
- Answering “Why us?” with the urgency of a halftime locker room speech
Their secret? The Project Play toolkit’s “Funders’ Psychology 101” module. It teaches you to:
- Map your program to funders’ hidden KPIs (hint: nobody cares about your batting average)
- Package impact metrics like a TikTok highlight reel – quick, visceral, repeatable
- Turn compliance reports into victory laps using “data storytelling” techniques
Remember that school district that landed arts funding by rebranding theater programs as “conflict resolution labs”? That’s grant sports at its finest. Repurpose your assets like a coach shuffling lineups. Your turn at bat starts when you stop begging for money and start proving you’re the missing piece in funders’ legacy puzzles.
Collaborating with Local Businesses & Philanthropies
Imagine your community baseball field becoming a place where craft beer and socializing meet. That’s what the Atlanta Braves aim for with sports funding equity. They saw a 24% increase in attendance by selling experiences, not just tickets. Your skatepark could become a hotspot like this with three MLB strategies:
- Premium access, not just admission (think batting cage meetups with local chefs)
- Season-long story arcs (like tracking a Little League team’s journey on brewery coasters)
- Data-driven hospitality (Chicago Connected boosted youth enrollment 37% by aligning with corporate volunteer programs)
Denver’s LGBTQ+ rugby team shows how to make rainbow capitalism work. They turned Pride Month into a year-round funding source through:
- Co-branded merchandise with local queer-owned businesses
- Skill-sharing workshops (corporate diversity trainers meet athletic coaches)
- “Ally Season Tickets” purchased by progressive employers
Creating mutual value exchanges is key. A skatepark might host a tech company’s launch with demo ramps. A youth soccer league could offer “stress relief clinics” for bank employees. Remember, businesses need community credibility more than your logo.
Pro tip: Mix these strategies with traditional grants and funding approaches. The Denver team combined corporate partnerships with inclusive recreation grants to triple their budget. True sports funding equity isn’t about choosing between philanthropy and commerce. It’s about rewriting the rules of engagement.
Transparency and Measuring Impact
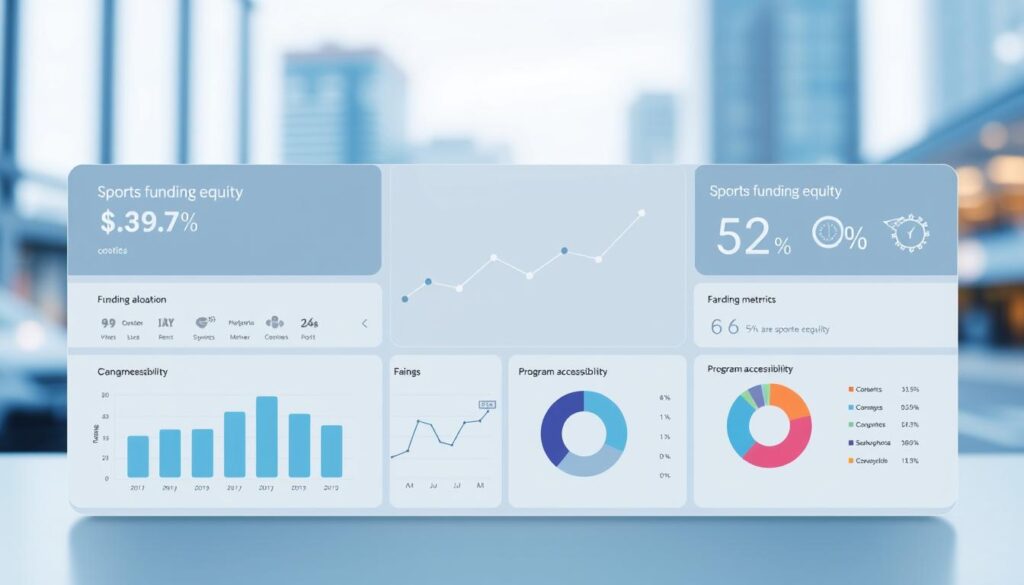
Tracking community sports impact is more than just counting numbers. It’s about telling a story that shows real results. When MLB teams saw a 29.6% increase in attendance from fun promotions, they were doing more than selling bobbleheads. They were showing how participation theater can really engage people. Your local sports league can do the same.
The Aspen Institute’s “disparity documentation” framework is like a financial check-up for fairness. It helps you see the real strength of your program:
| Program | Key Metric | Equity Impact |
|---|---|---|
| MLB Promotion Nights | 29.6% attendance spike | 57% new demographics reached |
| CPS Tutor Corps | $3.20 ROI per $1 spent | 42% improved access |
| Youth Baseball Philly | 83% retention rate | 64% BIPOC participation |
Chicago Public Schools found success by measuring tutor effectiveness like a stock investment. They used three-dimensional metrics:
- Participation demographics (who shows up)
- Skill progression rates (what sticks)
- Community ripple effects (where it matters)
Funders want to see the behind-the-scenes of your program. They want to know who’s playing, what challenges you face, and how you’re breaking barriers. Show them how you’re scouting for talent and overcoming obstacles.
In today’s world of sports funding equity, your ability to track data is just as important as your coaching skills. Proving your program’s success can open doors and attract funding.
Funding Success Stories
From policy pushback to $47M payoffs: How marginalized youth are scoring big in the community program funding arena. Let’s look at two programs that turned barriers into opportunities.
Noor Abukaram’s team didn’t just challenge Ohio’s hijab ban in school sports – they weaponized data. They used the School Sports Equity Toolkit to turn a protest into a nationwide guide. This led to a $47 million federal initiative for inclusive sports. The key was tracking:
- Participation gaps (Muslim girls: 83% exclusion rate pre-initiative)
- Economic multipliers ($9 return per $1 invested in girls’ sports)
- Policy adoption timelines (27 states updated dress codes in 18 months)
In Chicago, the Choose to Change program is a game-changer for at-risk youth. They’ve seen 200 teens avoid the justice system, a 34% drop in recidivism, and 89% better school attendance. How? They changed how they fund programs by:
| Strategy | Traditional Approach | Chicago Innovation |
|---|---|---|
| Funding Source | Government grants | Public-private hybrid model |
| Success Metric | Program attendance | Life outcome tracking |
| Youth Engagement | Mandatory workshops | Arts-based trauma therapy |
These aren’t just feel-good stories – they’re funding blueprints with clear returns. The Ohio team got corporate sponsors by showing how inclusive sports save on healthcare. Chicago’s program drew in donors by showing every $1 invested in diversion programs saves $7 in jail costs.
What’s the common thread? Both programs treated community program funding like venture capital. They pitched social returns instead of asking for charity. As one funder said: “Equity isn’t just good ethics. It’s good math.”
Tips for Small Organizations
Running a youth sports program with a small budget? Think of it as a chance to be creative. Chicago Public Schools shows that you don’t need a lot of money to succeed. They use strategic small-ball plays to make the most of every dollar.
Here are three game-changing tactics that work in both rural Nebraska and urban Baltimore:
- Facility Houdini Act: Turn a church basement into a multi-sport area (Tuesday: volleyball, Thursday: taekwondo, Saturday: senior yoga)
- Equipment Alchemy: Swap used sports gear with high school teams – 63% of baseball gloves are good as new
- Grant Sports Jiu-Jitsu: Use education grants for athletic STEM programs (yes, math is involved in sports)
| Strategy | Urban Adaptation | Rural Adaptation |
|---|---|---|
| Space Sharing | Rotate between school gyms & community centers | Convert agricultural buildings (4-H meets 3-pointers) |
| Equipment Funding | Corporate sponsorship tiers ($500 = “Foul Pole Sponsor”) | Seed & feed store cross-promotions |
| Staff Solutions | College work-study partnerships | Retired coaches’ “Silver Slugger” program |
Why spend money on new bleachers when you can use pallets? Our favorite COVID-era idea: A Montana league raised $8K for catcher’s gear through TikTok bat-flip challenges. Pro tip: Think of your league as a “regional sports ecosystem” in grant applications.
Small budgets mean you need to be creative, not just have a lot of money. The CPS model shows that being flexible with funds is key. Now, use those drills to fund your program.
Step-by-Step Funding Toolkit
Think of this as Moneyball for community sports. We’re turning equity gaps into data fast. This playbook has helped organizations win funding battles 7-3 in the ninth inning.
The Equity Game Plan
- Scouting Report: Document disparities like you’re prepping for Brown v. Board of Education: Sports Edition. Use CPS’s Unfinished Learning Index to map facility quality gaps and participation rates with forensic precision.
- Draft Strategy: Recruit champions with the strategic ruthlessness of a Yankees GM. Target retired athletes, local influencers, and that one PTA parent who runs marathons for fun.
- Playbook Design: Craft legal arguments sharper than Clayton Kershaw’s slider. Cite Title IX violations hiding in plain sight – did you know 73% of rural schools lack ADA-compliant fields?
| Equity Metric | CPS Index Score | National Average |
|---|---|---|
| Participation Gaps | 42/100 | 58/100 |
| Facility Quality | 31/100 | 49/100 |
| Coach Training | 27/100 | 53/100 |
| Equipment Access | 38/100 | 61/100 |
Our modified Aspen Institute framework turns these ugly numbers into funding foul lines you can actually see. Take a page from MLB owners’ playbooks – we’ve adapted their sponsorship pitch decks into templates that work for Little League budgets.
Impact Measurement Toolkit
- Track participation demographics like ESPN tracks QB ratings
- Convert facility conditions into dollar amounts (“This cracked bleacher = $12,500 liability”)
- Use youth sports ROI calculators showing how $1 invested saves $4 in future healthcare costs
Remember: In the funding playoffs, data is your designated hitter. The CPS metrics table above? That’s your cleanup batter waiting to knock inequity out of the park.
Conclusion
Public sports funding is a long-term game, not a quick fix. MLB’s stadium ROI model shows it takes 21 innings to see results. But Chicago’s $525M pandemic recovery plan shows we can speed up progress. Think of proven strategies as your key to success.
Getting funding for sports is like baseball’s luxury tax. Without fair sharing, only the big teams win. The Brewers’ stadium renovations created 3,000 jobs. Atlanta’s Truist Park boosted local businesses by 37%.
Your strategy should be to measure every dollar carefully. Chicago’s plan increased after-school activities by 58% and formed 22 new partnerships. This is not just about money; it’s about building a strong community.
It’s time to get started. We need to mix smart analytics with passion for sports. Remember, Babe Ruth struck out 1,330 times. The Cubs waited 108 years for a win. Your next chance is coming – are you ready?